Time Series Smoothing for Anomaly Detection
Source: https://arpitbhayani.me/blogs/ts-smoothing Date: 2020-11-01
Learn how to optimally smooth time series data using kurtosis to highlight anomalies. Prioritize user attention with this smoothing technique.
Time series is a collection of numerical data points (often measurements), gathered in discrete time intervals, and indexed in order of the time. Common examples of time series data are CPU utilization metrics, Temperature of some geolocation, New User Signups of a product, etc.
Observing time-series of critical metrics helps in spotting trends, aberrations, and anomalies. Time series forecasting helps in predicting future demand and thus aids in altering and adjusting the supply to match that. Software companies continuously monitor hundreds of time series plots for anomalies that, if unattended, could result in downtime or a loss in revenue.
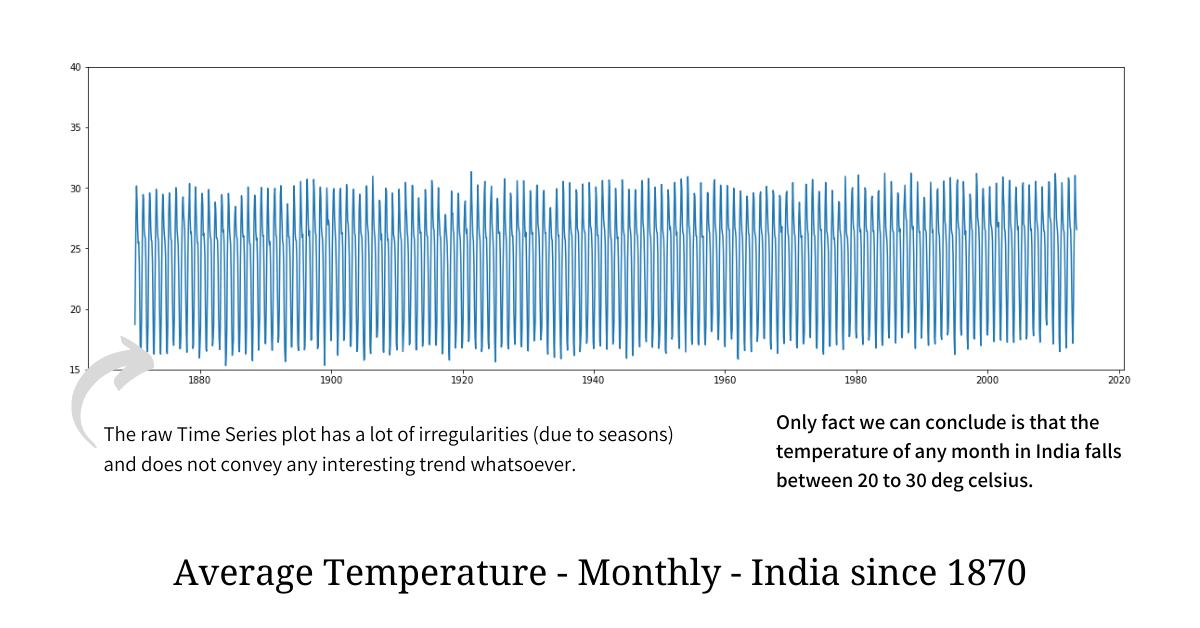
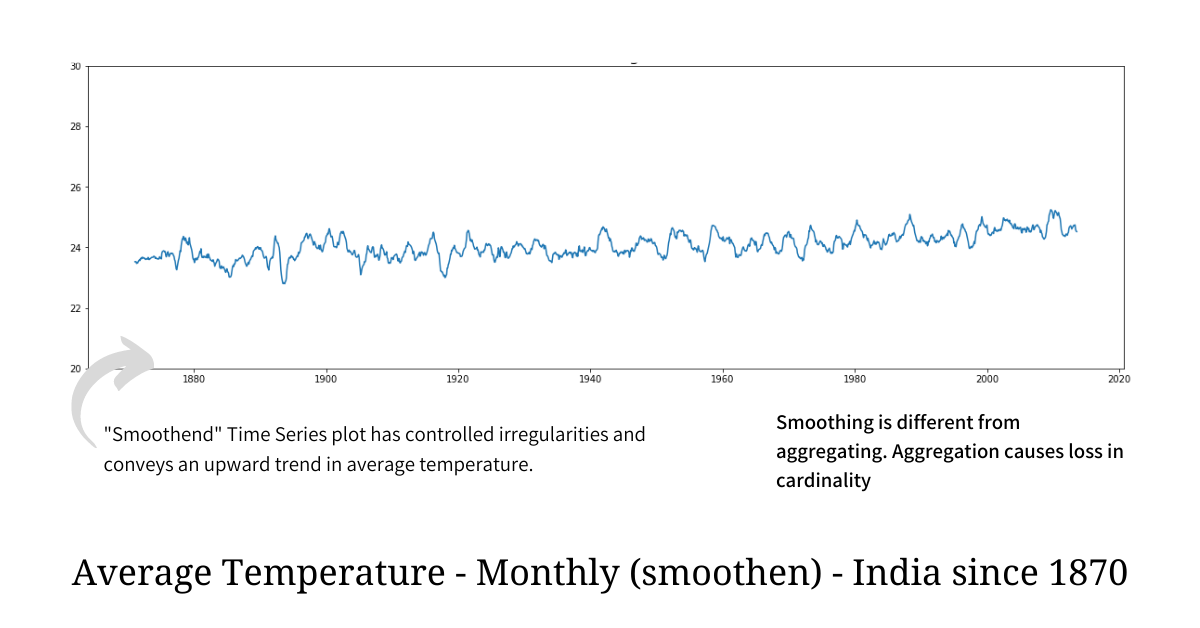
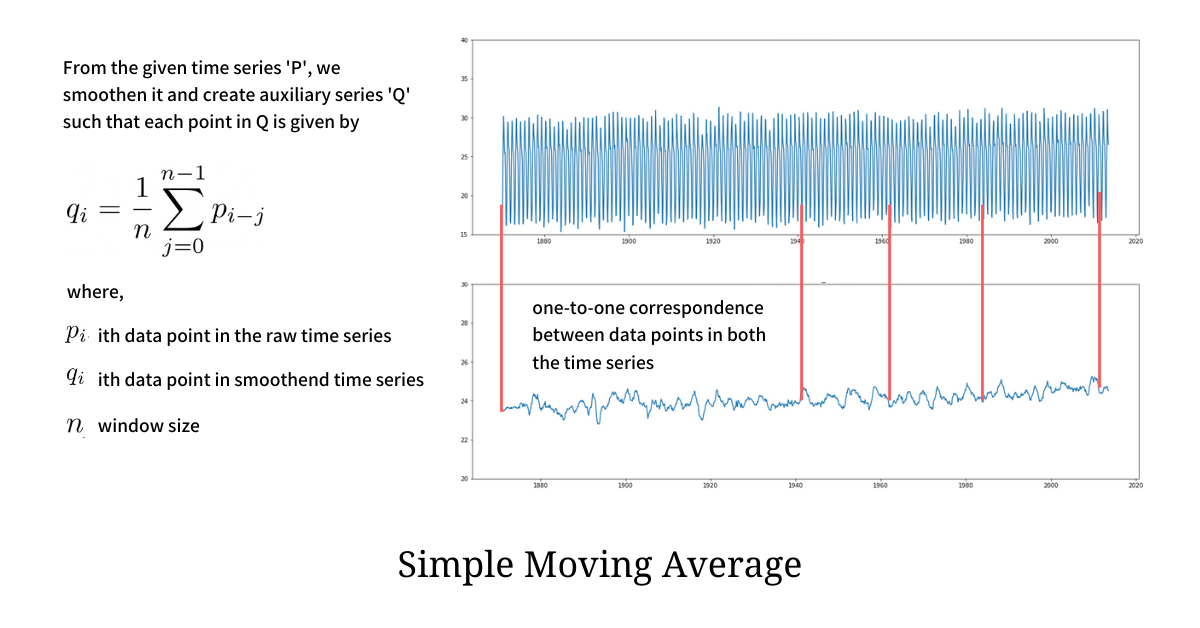
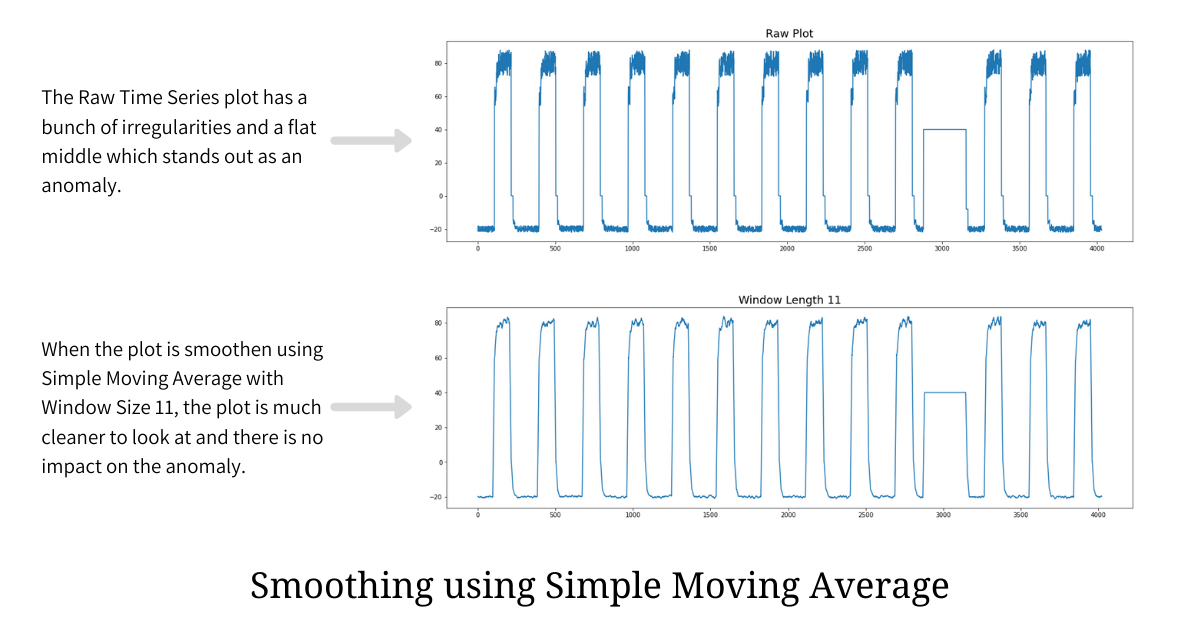
Unfortunately, time series data have a lot of short-term irregularities, often making it harder for the observer to spot the sudden spikes and true anomalies; and which is where the need for arises. By smoothing the plot we get rid of the irregularities, to some extent, while enabling the observer to clearly see the patterns, trends, and anomalies.